My Learning Circle

Activity Library

Hundreds of Activities to Do With Your Child.

Play-based, teacher-designed activities for ages 3–8. Browse free, start today.

Showing 1–12 of 23 activities

All Activities

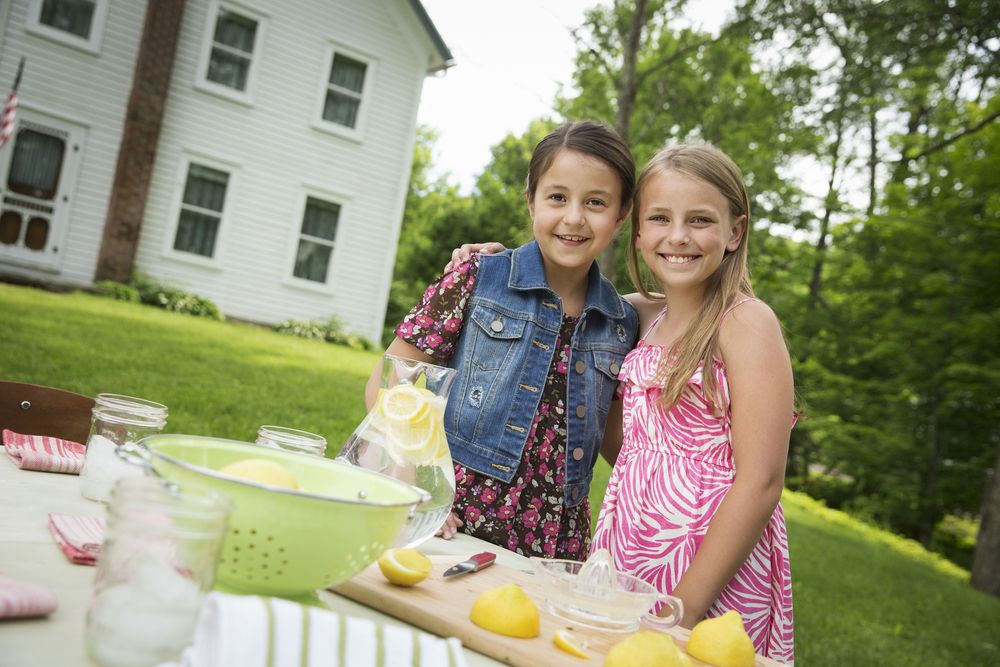
Family Lemonade StandMATH15–20 min

Primary Learners (Ages 7-9)

Family Lemonade Stand

Children progress at different rates based on interest and ability. Choose what works best for your child. Use these plans as a flexible guide. Many lessons are interdisciplinary, covering multiple content areas. Teach them as stand-alone activities or combine 4–5 into a weekly unit. Each plan is play-based and screen-minimal and builds social-emotional and higher-order thinking skills alongside academics.

Open Activity →
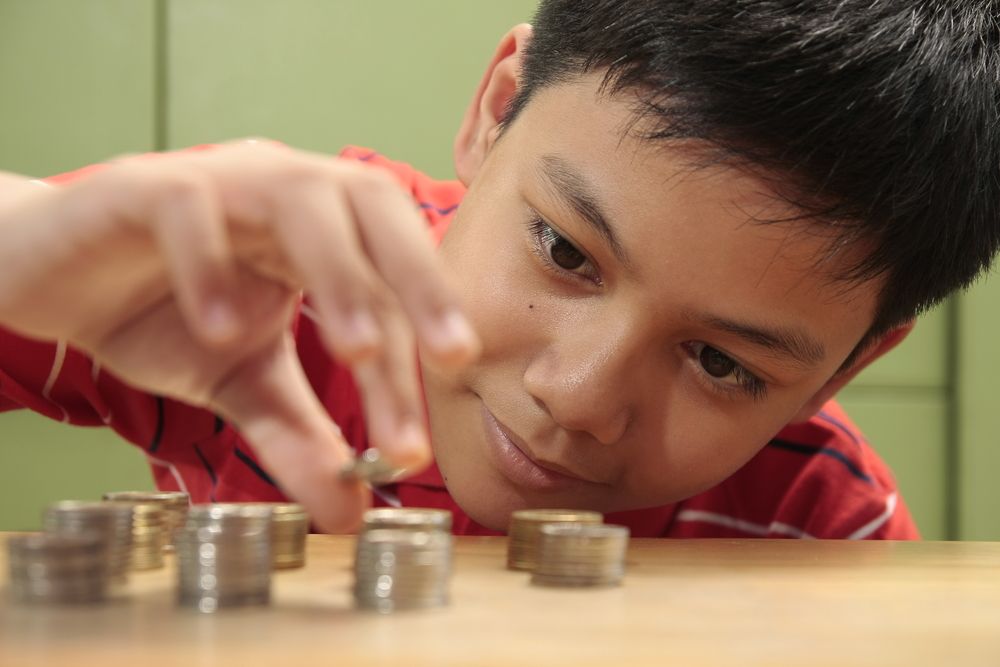
Coin Store at HomeMATH15–20 min

Early Learners (Ages 5-6)

Coin Store at Home

Children progress at different rates based on interest and ability. Choose what works best for your child. Use these plans as a flexible guide. Many lessons are interdisciplinary, covering multiple content areas. Teach them as stand-alone activities or combine 4–5 into a weekly unit. Each plan is play-based and screen-minimal and builds social-emotional and higher-order thinking skills alongside academics.

Open Activity →
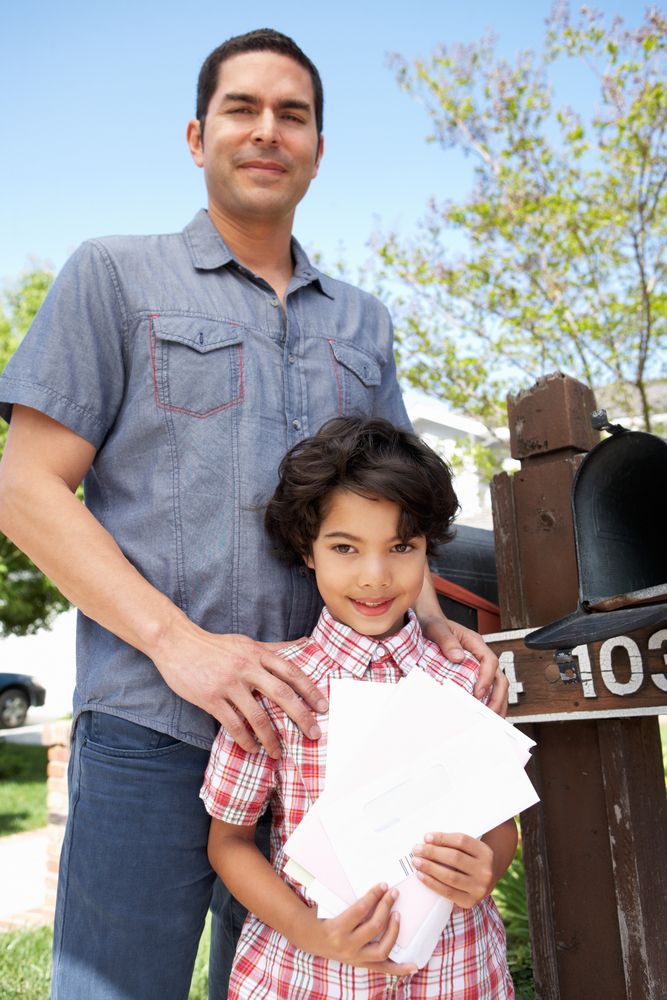
Counting Steps to the MailboxMATH15–20 min

Discoverers (Ages 3-4)

Counting Steps to the Mailbox

Children progress at different rates based on interest and ability. Choose what works best for your child. Use these plans as a flexible guide. Many lessons are interdisciplinary, covering multiple content areas. Teach them as stand-alone activities or combine 4–5 into a weekly unit. Each plan is play-based and screen-minimal and builds social-emotional and higher-order thinking skills alongside academics.

Open Activity →
Animal HabitatsMATH30–45 min

Primary Learners (Ages 7-9)

Animal Habitats

Adaptations for survival, describe how physical characteristics and behaviors help survival, scientific investigation and explanation

Open Activity →
Collecting Data and GraphsMATH30 min

Primary Learners (Ages 7-9)

Collecting Data and Graphs

Drawing conclusions and making predictions, explain that the length of a bar in a bar graph or the number of pictures in a pictograph represents the number of data points for a given category.

Open Activity →
Color Preferences GraphMATH30 min

Primary Learners (Ages 7-9)

Color Preferences Graph

Drawing conclusions and making predictions, explain that the length of a bar in a bar graph or the number of pictures in a pictograph represents the number of data points for a given category.

Open Activity →
The Water CycleMATH30 min

Primary Learners (Ages 7-9)

The Water Cycle

Drawing conclusions and making predictions, explain that the length of a bar in a bar graph or the number of pictures in a pictograph represents the number of data points for a given category.

Open Activity →

Showing 12 of 23 activities

Load more

Free to start

Ready to Try One?

Create a free account to access all 23 activities. No credit card required.