Activity Library

Hundreds of Activities to Do With Your Child.

Play-based, teacher-designed activities for ages 3–8. Browse free, start today.

Showing 13–24 of 26 activities

All Activities

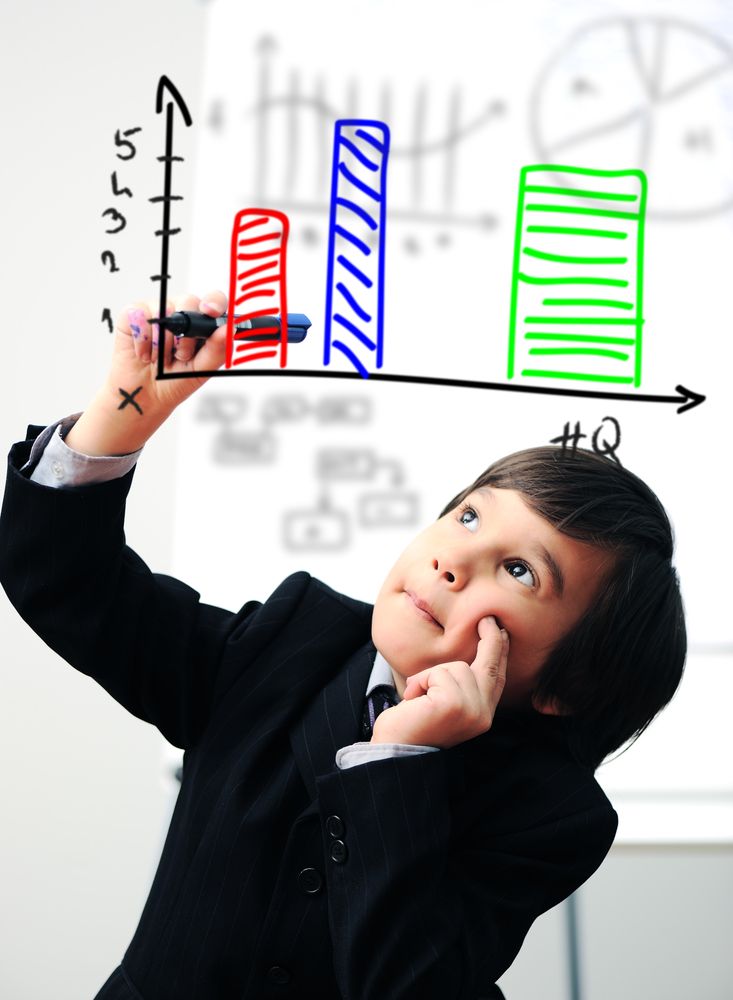
Collecting Data and GraphsMATH30 min

Primary Learners (Ages 7-9)

Collecting Data and Graphs

Drawing conclusions and making predictions, explain that the length of a bar in a bar graph or the number of pictures in a pictograph represents the number of data points for a given category.

Open Activity →
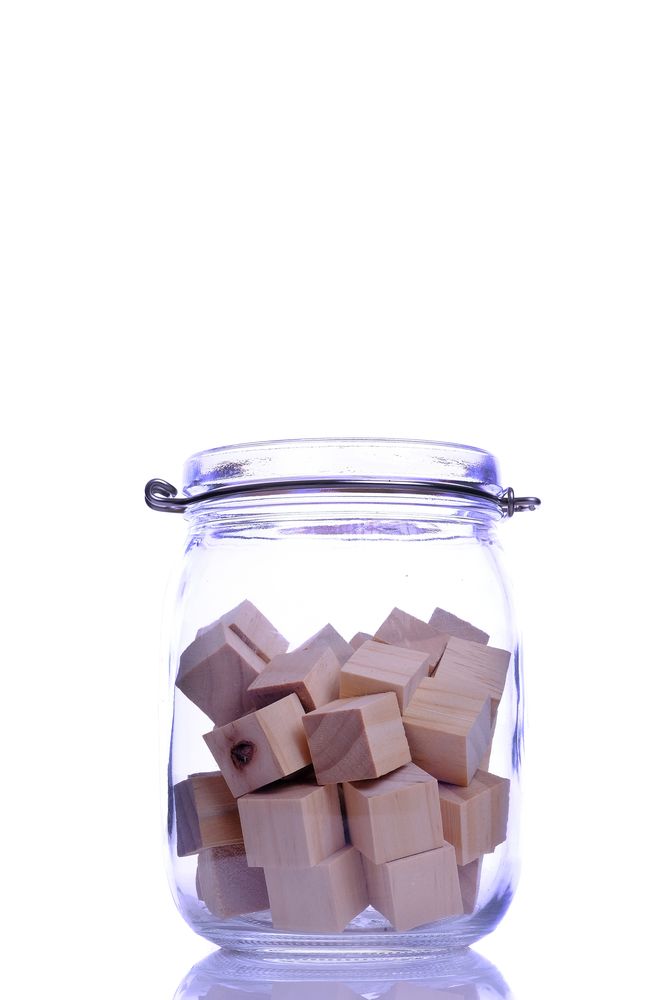
Color Preferences GraphMATH30 min

Primary Learners (Ages 7-9)

Color Preferences Graph

Drawing conclusions and making predictions, explain that the length of a bar in a bar graph or the number of pictures in a pictograph represents the number of data points for a given category.

Open Activity →
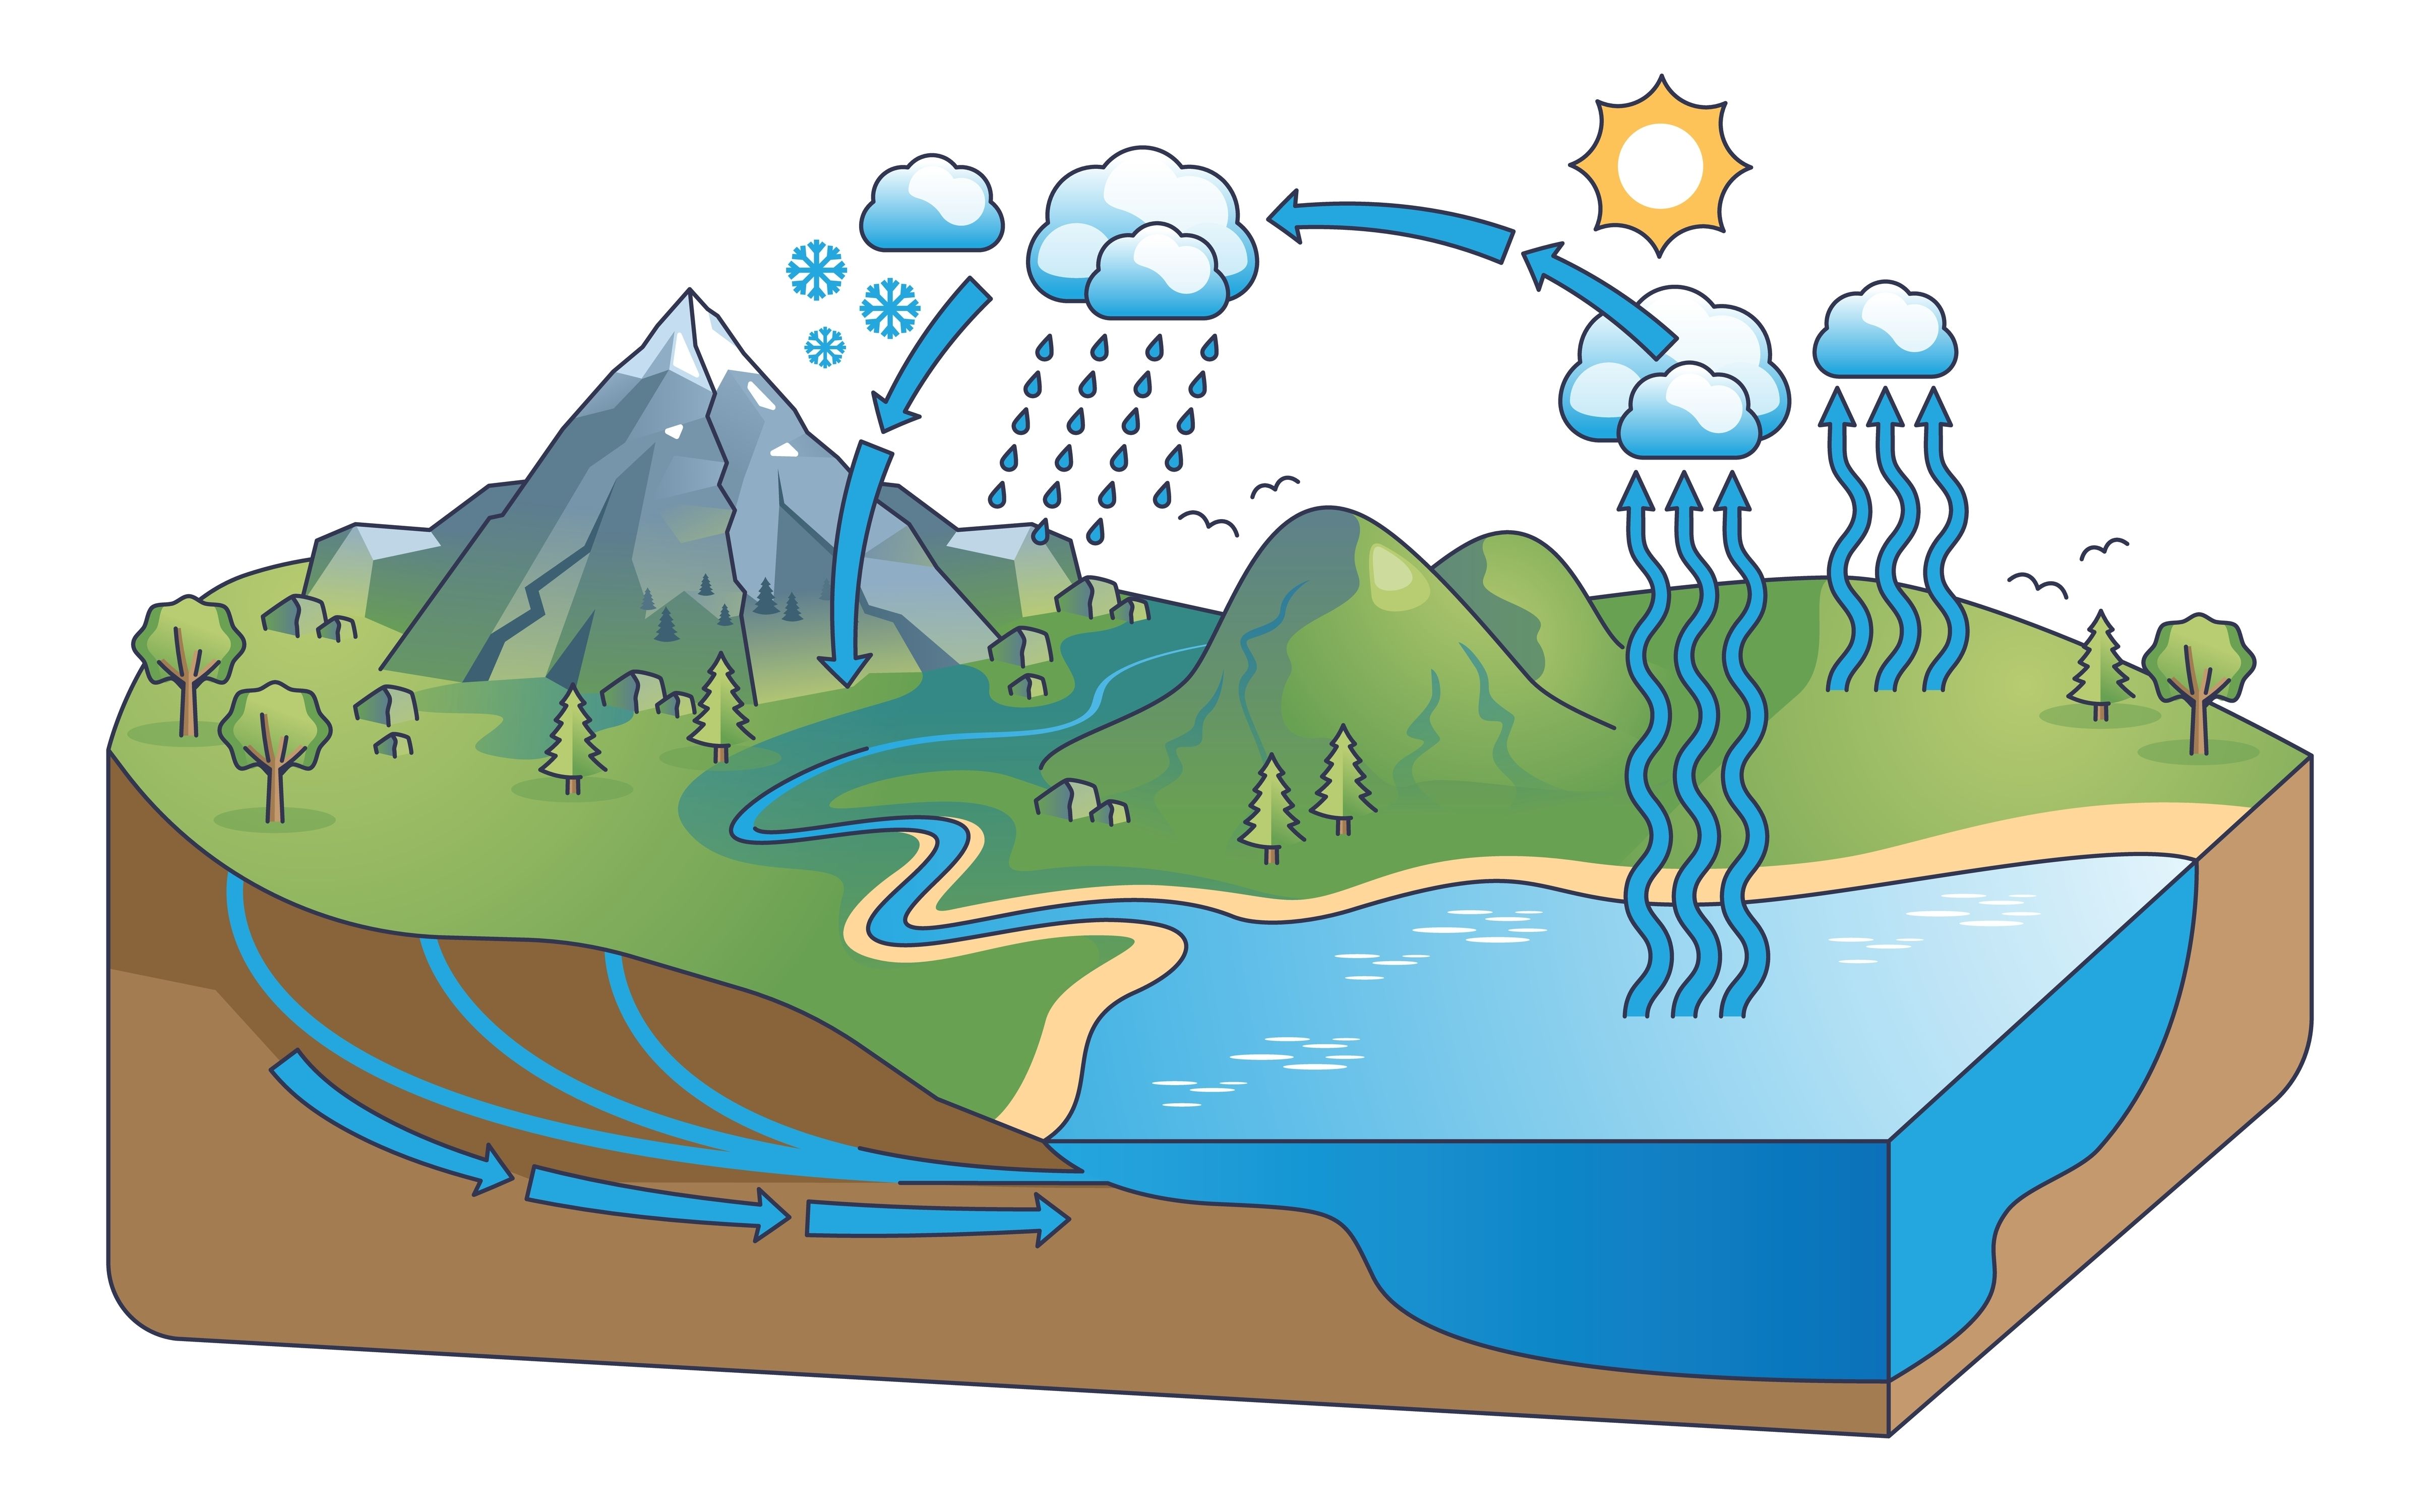
The Water CycleMATH30 min

Primary Learners (Ages 7-9)

The Water Cycle

Drawing conclusions and making predictions, explain that the length of a bar in a bar graph or the number of pictures in a pictograph represents the number of data points for a given category.

Open Activity →
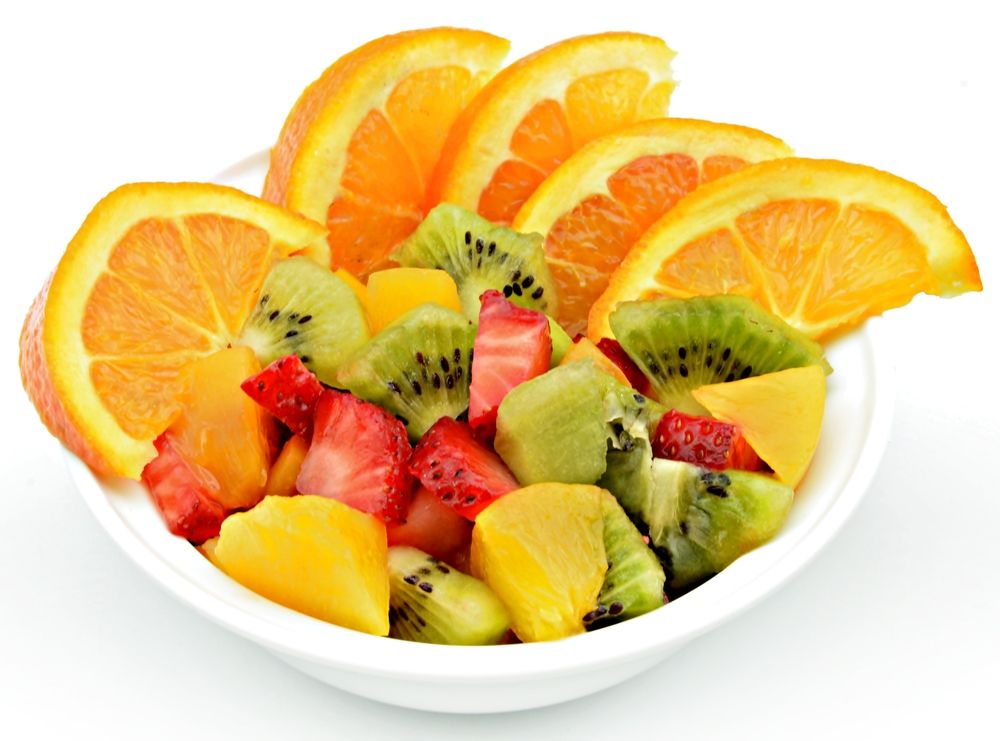
Applying Math to Everyday LifeMATH20–25 min

Early Learners (Ages 5-6)

Applying Math to Everyday Life

Children need to be able to compare the difference, or similarities with different toys and other items that they use and be able to organize them into categories.

Open Activity →

Showing 24 of 26 activities

Load more

Free to start

Ready to Try One?

Create a free account to access all 26 activities. No credit card required.